

By Shane Lasley
Mining News
Alaska mine output drops, nation's rises
USGS report provides first look at mineral production stats North of 60 Mining News – February 7, 2020
Last updated 9/26/2020 at 11:53am
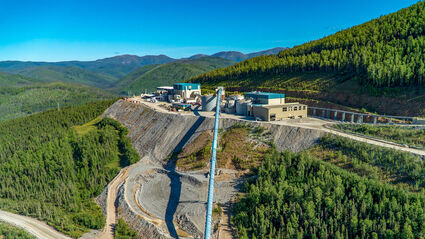
Northern Star Resources Ltd.
With improvements made by Northern Star Resources, gold output at the Pogo Mine in Alaska is expected to increase significantly in 2020.
Alaska mines produced roughly $3.13 billion worth of non-fuel minerals last year, down roughly 9 percent from the US$3.44 billion in 2018, according to Mineral Commodity Summaries 2020, an annual report published by the U.S. Geological Survey on Feb. 6 – the earliest comprehensive source of world mineral production data.
The drop in Alaska mine production value is largely due to lower output from the two largest gold mines in the state – Fort Knox and Pogo.
According to early estimates by the Alaska Division of Geological & Geophysical Surveys, Alaska mines produced roughly 1.3 billion pounds of zinc, 247 million lb of lead, 568,000 ounces of gold and 16 million oz silver.
The gold production is down significantly from the roughly 712,000 oz produced in 2018 and more than 1 million oz produced as recently as 2013.
Alaska gold production in 2020 is expected to rebound some from expected higher gold output at Northern Star Resources Ltd.'s Pogo Mine.

With falling production values, Alaska fell to the nation's eighth-largest mineral producing state – behind Nevada, Arizona, Texas, Minnesota, California, Florida and Utah.
Nevada, the top mining state in the nation, produced US$8.19 billion worth of non-fuel minerals in 2019. This output was dominated by gold, diatomite (also known as diatomaceous earth) and copper.
Roughly $86.3 billion of non-fuel minerals were produced in the United States during 2019, a roughly 3 percent increase over 2018.
"Decision makers and leaders in both the private and public sectors rely on the crucial, unbiased statistics and data provided in the Mineral Commodity Summaries to make business decisions and determine national policy," said Michael Magyar, acting director, National Minerals Information Center. "Industries – such as steel, aerospace and electronics – (that) processed nonfuel mineral materials created an estimated $3.13 trillion in value-added products in 2019, which represents a 2.5 percent increase over 2018."

Critical mineral reliance
USGS continues to highlight America's dependence on foreign countries for many minerals critical to the nation's economy and security.
According to this year's report, the United States continues to rely on foreign sources for some raw and processed mineral materials. In 2018, imports made up more than half of U.S apparent consumption for 46 nonfuel mineral commodities, and the U.S. was 100 percent net import reliant for 17 of those.

"Critical minerals comprised 14 of the 17 mineral commodities with 100 percent net import reliance and comprised 17 of the 29 remaining mineral commodities with imports greater than 50 percent of annual consumption," USGS noted in its report.
According to the data compiled by USGS, China continues to be the largest supplier of these mineral commodities to the U.S., followed by Canada.
While the number of mineral commodities on which the U.S. is 100 percent reliant is down from 20 in 2017, it still poses a risk as countries vie for many of the materials needed for green energy, high-tech devices, military hardware and common household products.

The Trump administration released, "A Federal Strategy to Ensure a Reliable Supply of Critical Minerals," last year to make America's economy and defense more secure. This strategy directed the U.S. Department of the Interior, which is over USGS, to locate domestic supplies of critical minerals, ensure access to information necessary for the study and production of minerals and expedite permitting for minerals projects.
"The data we are releasing today is vital to understanding which minerals are vulnerable to disruptions in America's supply chains and provides the analytical foundation for President Trump's broader strategy to make our economy and defense more secure," said Jim Reilly, director, USGS. "American production of minerals – having an estimated value of more than $86 billion – is critical for all means of commerce and manufacturing with many of these minerals being used in every day household items."

Pursuant to the federal strategy, USGS launched its Earth Mapping Resources Initiative – Earth MRI – to acquire geologic, geophysical and topographic data to help characterize the distribution of critical minerals and identify areas in which more data would improve our understanding of undiscovered critical mineral resources.
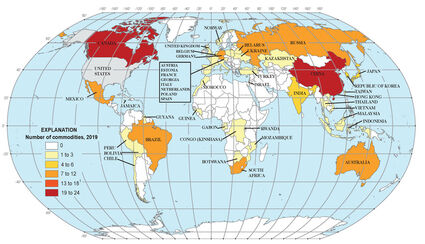
United States Geological Survey
Major sources of minerals for which the United States was greater than 50 percent import reliant in 2019.
In addition, USGS will conduct at least one multi-commodity critical mineral resource assessment every two years, supplying the results to federal land managers and the public.

Over his more than 16 years of covering mining and mineral exploration, Shane has become renowned for his ability to report on the sector in a way that is technically sound enough to inform industry insiders while being easy to understand by a wider audience.
- Email: [email protected]
- Phone: (907) 726-1095
- https://www.linkedin.com/in/shane-lasley-ab073b12/
Reader Comments(0)