

By Shane Lasley
Mining News
Alaska mine output rises, nation's drops
COVID-19, strong precious metals prices factor into shifts North of 60 Mining News – February 5, 2021
Last updated 2/10/2021 at 6:28am

Kinross Gold Corp.
Increased gold production and strong prices for the precious metal helped to push Alaska mine production values slightly higher during 2020. These bars are from the 8-millionth-ounce gold pour at Kinross Gold's Fort Knox Mine in October 2019.
Alaska mines produced roughly $3.16 billion worth of non-fuel minerals during 2020, a slight increase over the $3.13 billion during 2019, according to Mineral Commodity Summaries 2021 published by the U.S. Geological Survey on Feb. 2
The rise in Alaska mine production value is largely due to higher gold output at Alaska's large mines and record setting prices for the precious metal last year.
According to early estimates by the Alaska Division of Geological & Geophysical Surveys, Alaska mines produced roughly 1.2 billion pounds of zinc, 265 million lb of lead, 620,000 ounces of gold and 15.5 million oz silver.
The gold production is a roughly 9% increase from the 568,360 oz produced at the state's five gold producing hardrock mines.
Alaska gold production is expected to continue to trend higher during 2021 due to anticipated higher gold output at Kinross Gold Corp.'s Fort Knox and Northern Star Resources Ltd.'s Pogo, the two highest producing gold operations in the state.

With increasing production values, Alaska edged out Utah to move up to the seventh-highest mineral producing state – behind Nevada, Arizona, Texas, California, Minnesota, and Florida.
Nevada, the top mining state in the nation, produced US$9.14 billion worth of non-fuel minerals during 2020. This output was dominated by copper, gold, diatomite (also known as diatomaceous earth), lime, and silver.
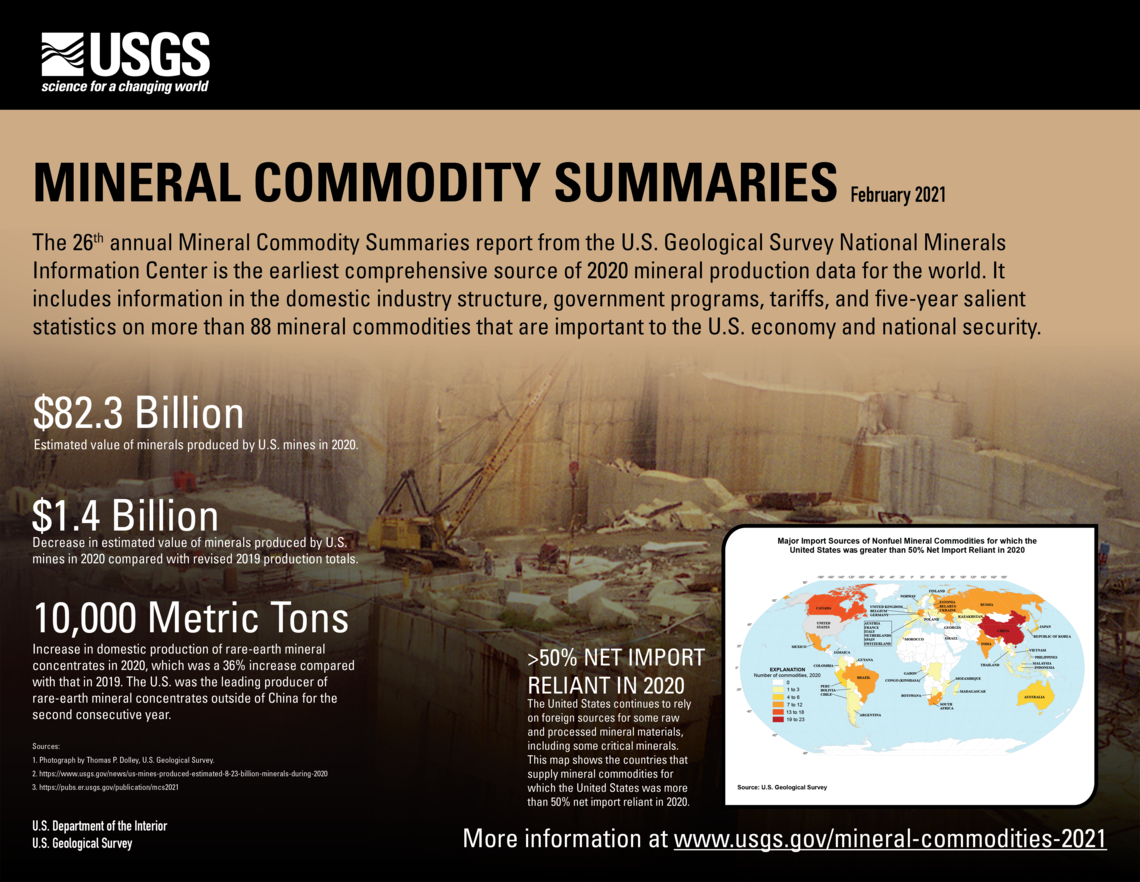
Roughly $82.3 billion of non-fuel minerals were produced in the United States during 2020, which is about $1.5 billion lower than the previous year.

USGS says this lower output from U.S. mines reflects a drop in demand for mined materials by industries that were slowed by the COVID-19 pandemic.
"Industries-such as steel, aerospace and electronics-that use nonfuel mineral materials created an estimated $3.03 trillion in value-added products in 2020, which represents a 3% decrease from that in 2019," said National Minerals Information Center Director Steven Fortier.
This industrial slowdown, however, was partially offset by prices for precious metals, such as gold, which reached a record peak of $2,060 per troy ounce in August.
USGS' annual Mineral Commodity Summaries report is the earliest comprehensive source of 2020 mineral production data for the world. The 2021 report includes information on the domestic mining sector, government programs, tariffs, and five-year statistics on more than 88 mineral commodities that are important to the U.S. economy and national security.
"Decision-makers and leaders in both the private and public sectors rely on the crucial, unbiased statistics and data provided in the Mineral Commodity Summaries to make business decisions and determine national policy," said Fortier.
Critical mineral reliance
The USGS Mineral Commodity Summaries continue to highlight America's dependence on foreign countries for most of the minerals, metals, and groups of elements critical to the nation's economy and security.

For 2020, the U.S. was dependent on imports for more than half its supply of 46 non-fuel mineral commodities and was 100% import-reliant for 17 of those.
"The U.S. relies entirely on imports for 17 mineral commodities, 14 of which are identified as critical minerals. Another 14 critical mineral commodities had a net import reliance greater than 50% of apparent consumption," USGS noted in its report.
America's net import reliance, however, was down slightly during 2020 due to the reduced industrial consumption of mined commodities resulting from the COVID-19 pandemic.
According to the data compiled by USGS, China continued to be the largest supplier of the mineral commodities imported into the U.S. last year, followed by Canada.
During 2020, the USGS and its partners developed a new tool for identifying which mineral commodities needed by America's manufacturing sector are most at risk to supply disruptions.

Evaluating the global supply of and U.S. demand for 52 mineral commodities over a decade beginning in 2007, the USGS methodology identified 23 mineral commodities, including cobalt, graphite, niobium, platinum group metals, many of the 17 rare earth elements, tantalum, and tungsten as posing the greatest supply risk for the U.S. manufacturing sector.
Out of the top 23 mineral commodities on the USGS risk assessment, six were rare earths – dysprosium (No. 1), yttrium (No. 2), neodymium (No. 3), lanthanum (No. 5), cerium (No. 6) and praseodymium (No. 12).
The lithium-ion battery metals cobalt (No. 4) and graphite (No. 7) are the top two non-rare earths on the USGS list of mineral commodities at risk for supply disruptions.
The USGS minerals supply risk tool allows businesses to better insulate themselves against those risks and provide policymakers a sharper focus on the minerals, metals, and groups of elements most critical to the United States.

Over his more than 16 years of covering mining and mineral exploration, Shane has become renowned for his ability to report on the sector in a way that is technically sound enough to inform industry insiders while being easy to understand by a wider audience.
- Email: [email protected]
- Phone: (907) 726-1095
- https://www.linkedin.com/in/shane-lasley-ab073b12/
Reader Comments(0)